Heatmaps
See which elements shoppers click, where they get stuck, and how far they scroll on each page.
Types of Heatmaps
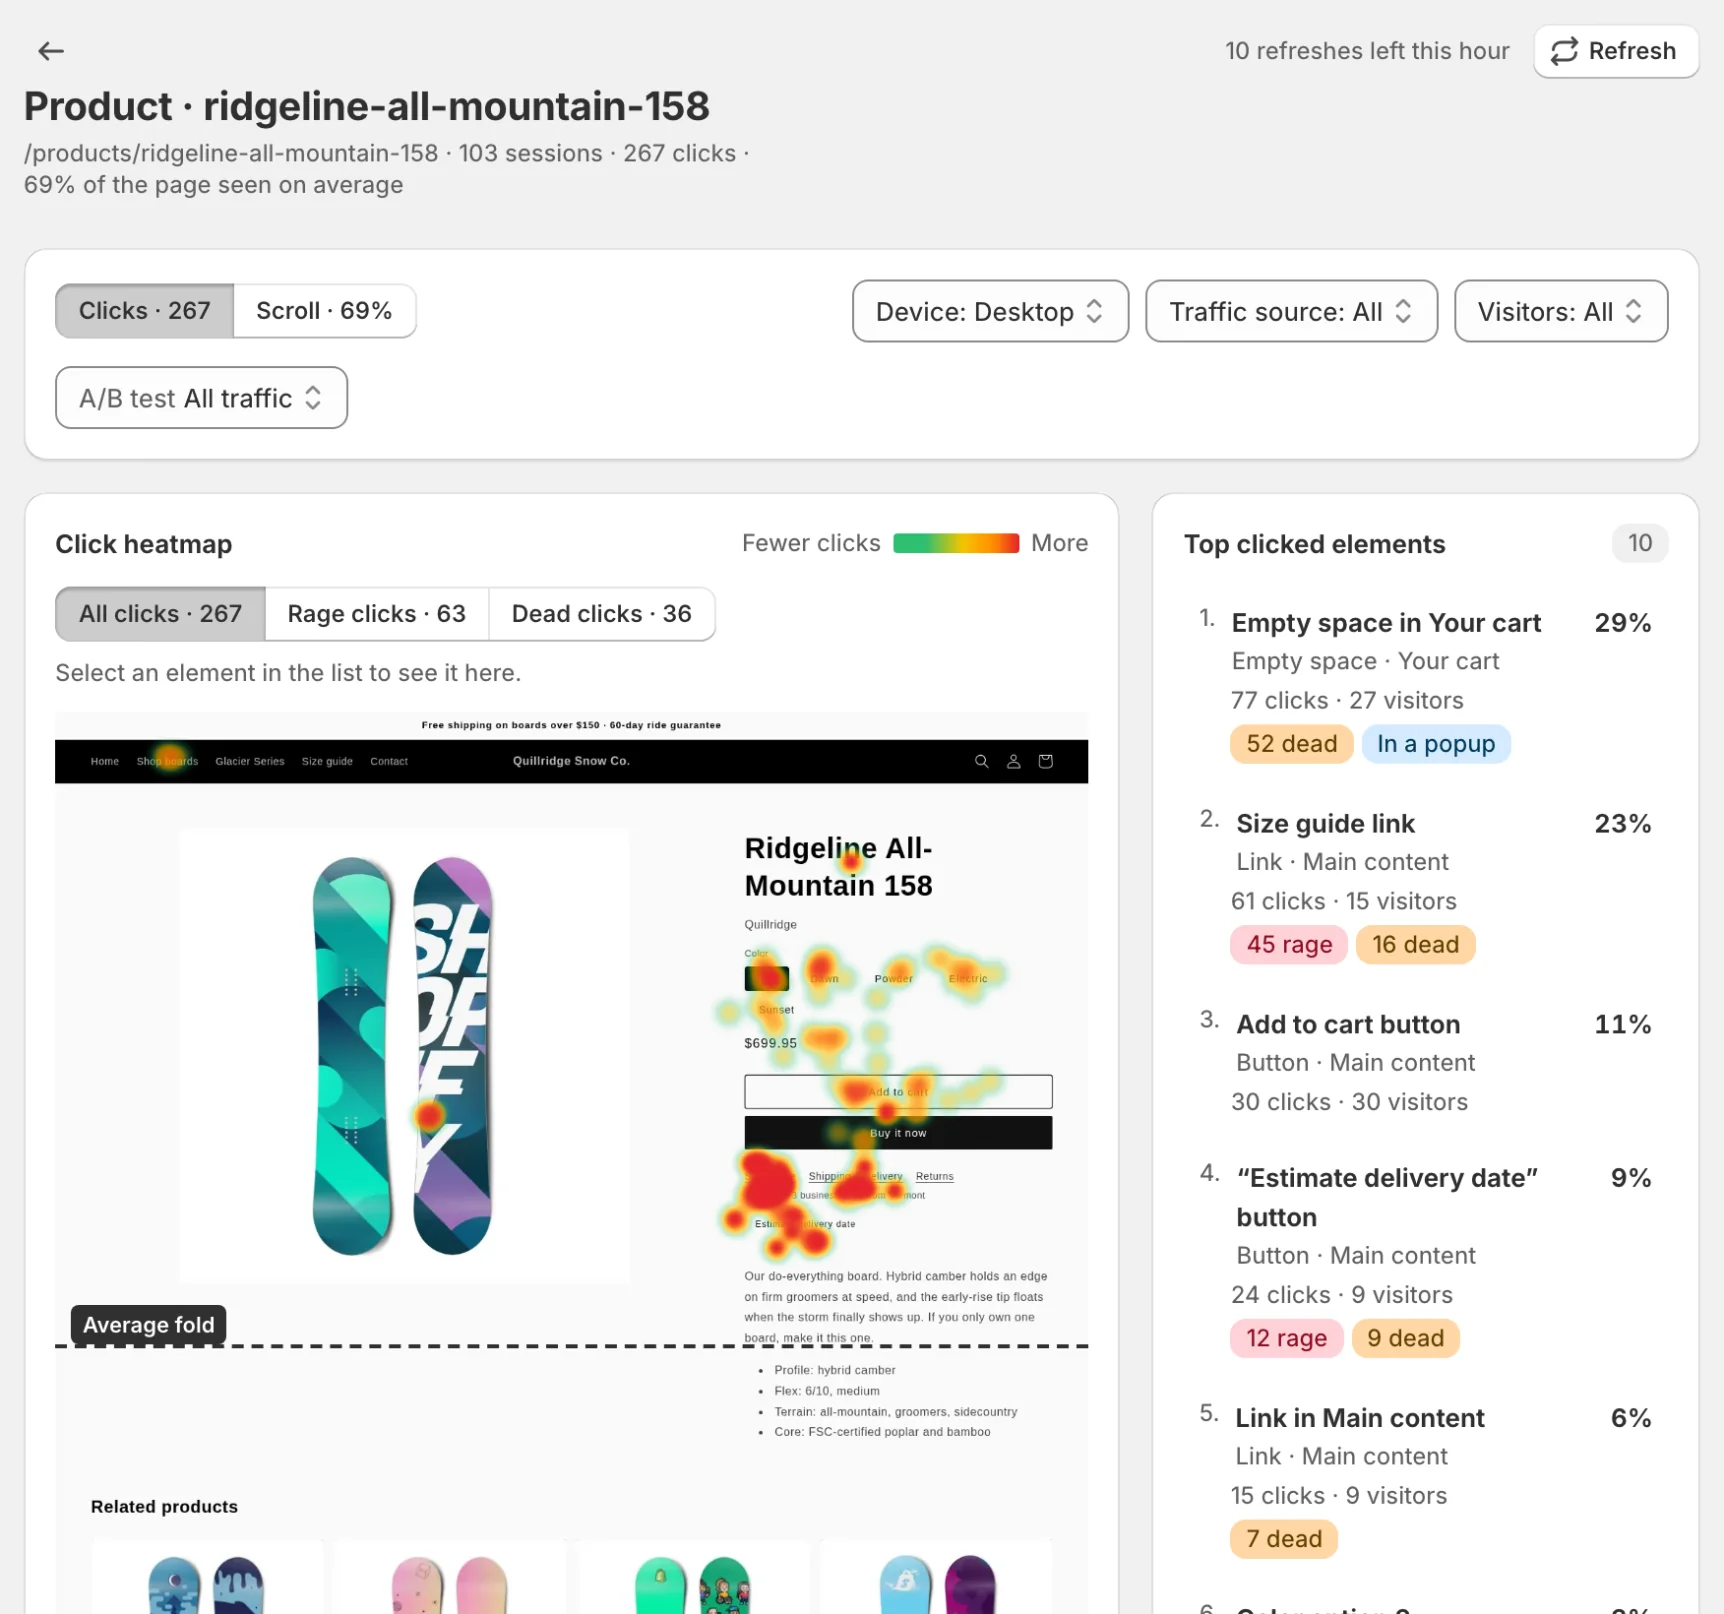
Click Maps
Click maps show where visitors click on your pages. Hot spots (red/orange) indicate high click activity, while cold spots (blue/green) show areas with fewer clicks.
Switch the click map between three layers:
- All clicks - every click on the page
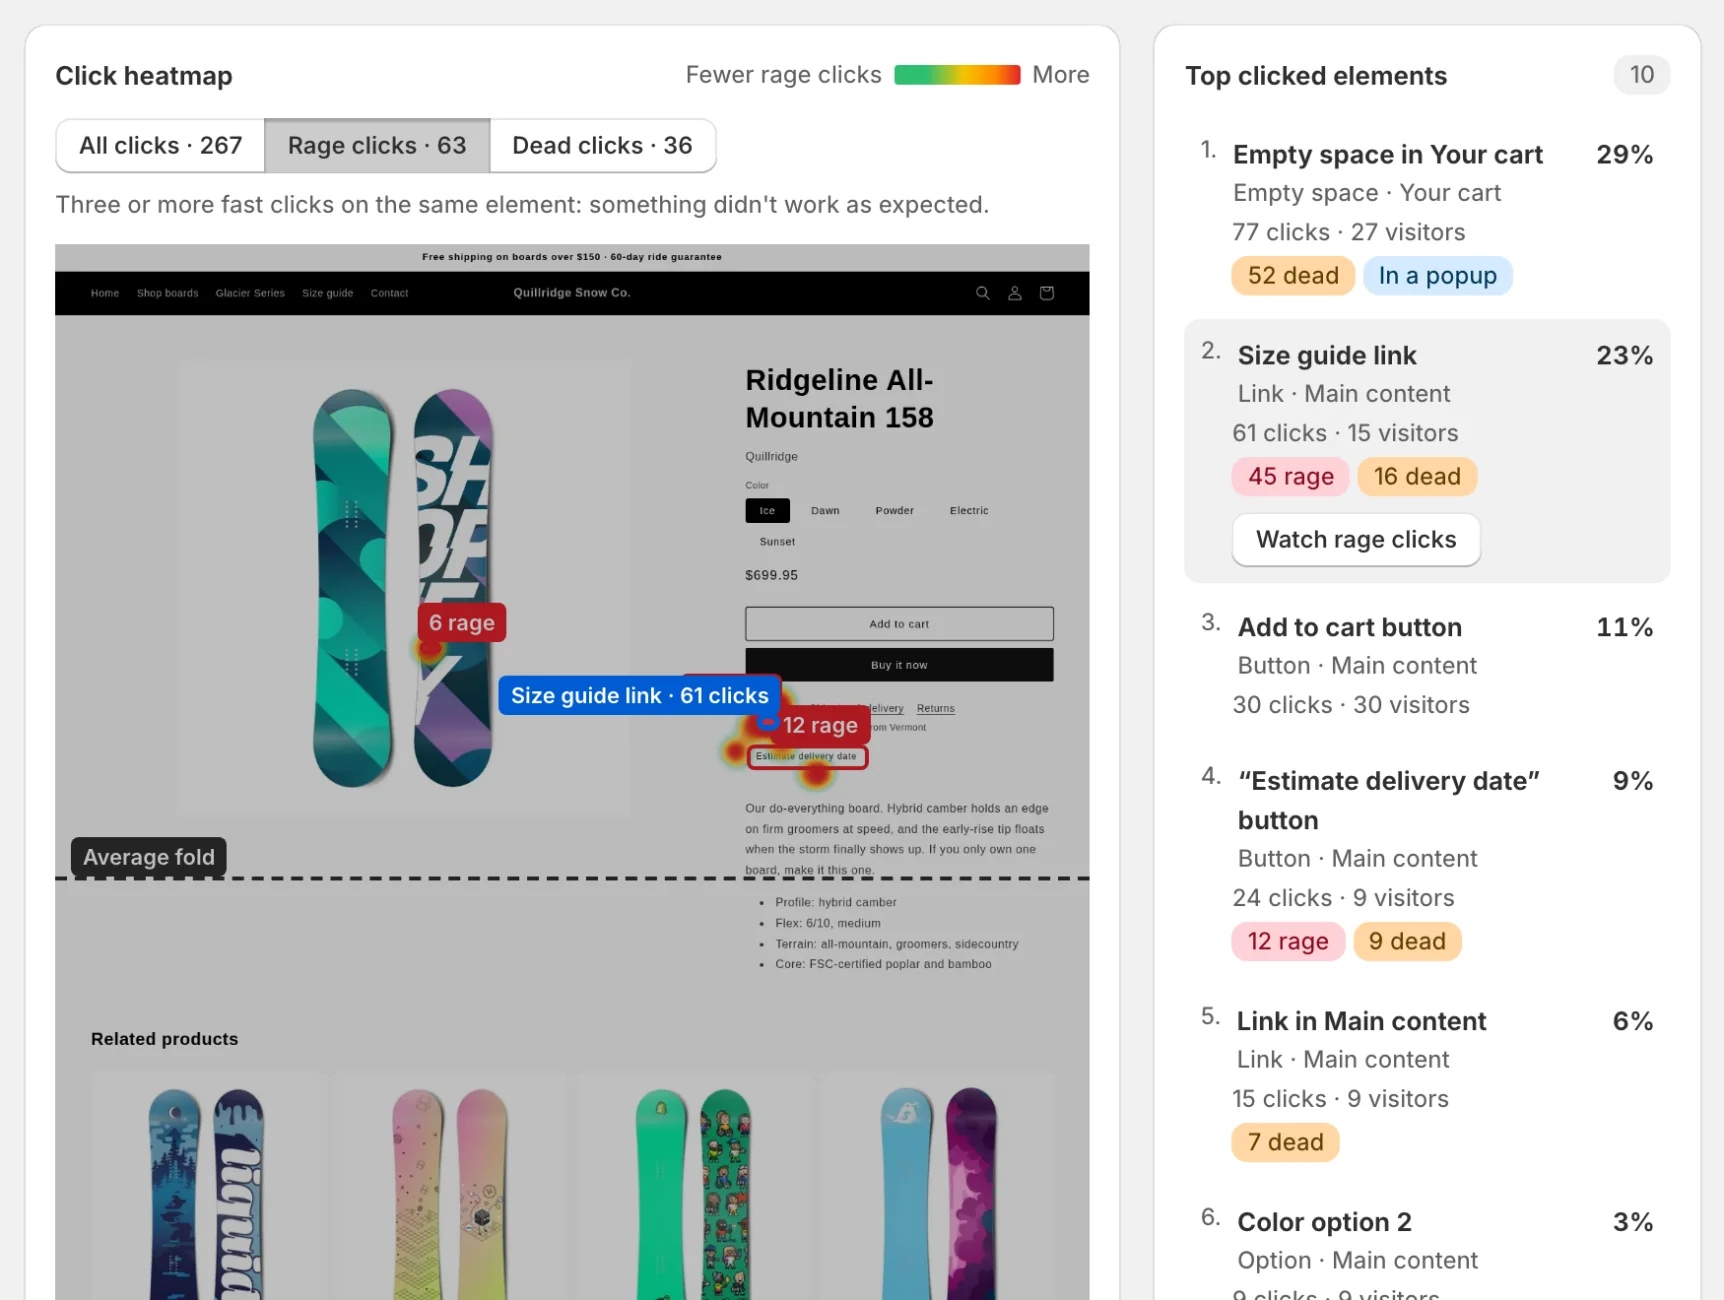
- Rage clicks - three or more fast clicks on the same element: something didn’t work as expected
- Dead clicks - clicks the page didn’t react to: shoppers expected something to happen
When shoppers clicked inside popups or the cart drawer, two more choices appear next to Page: Popups and banners (clicks inside popups, cookie banners and drawers) and Cart drawer (clicks inside the cart drawer). Those clicks are drawn where they were on screen, since the screenshot shows the page without them. Clicks on a sticky header or other element that stays put while the page scrolls are drawn where the shopper saw it, not further down the page.
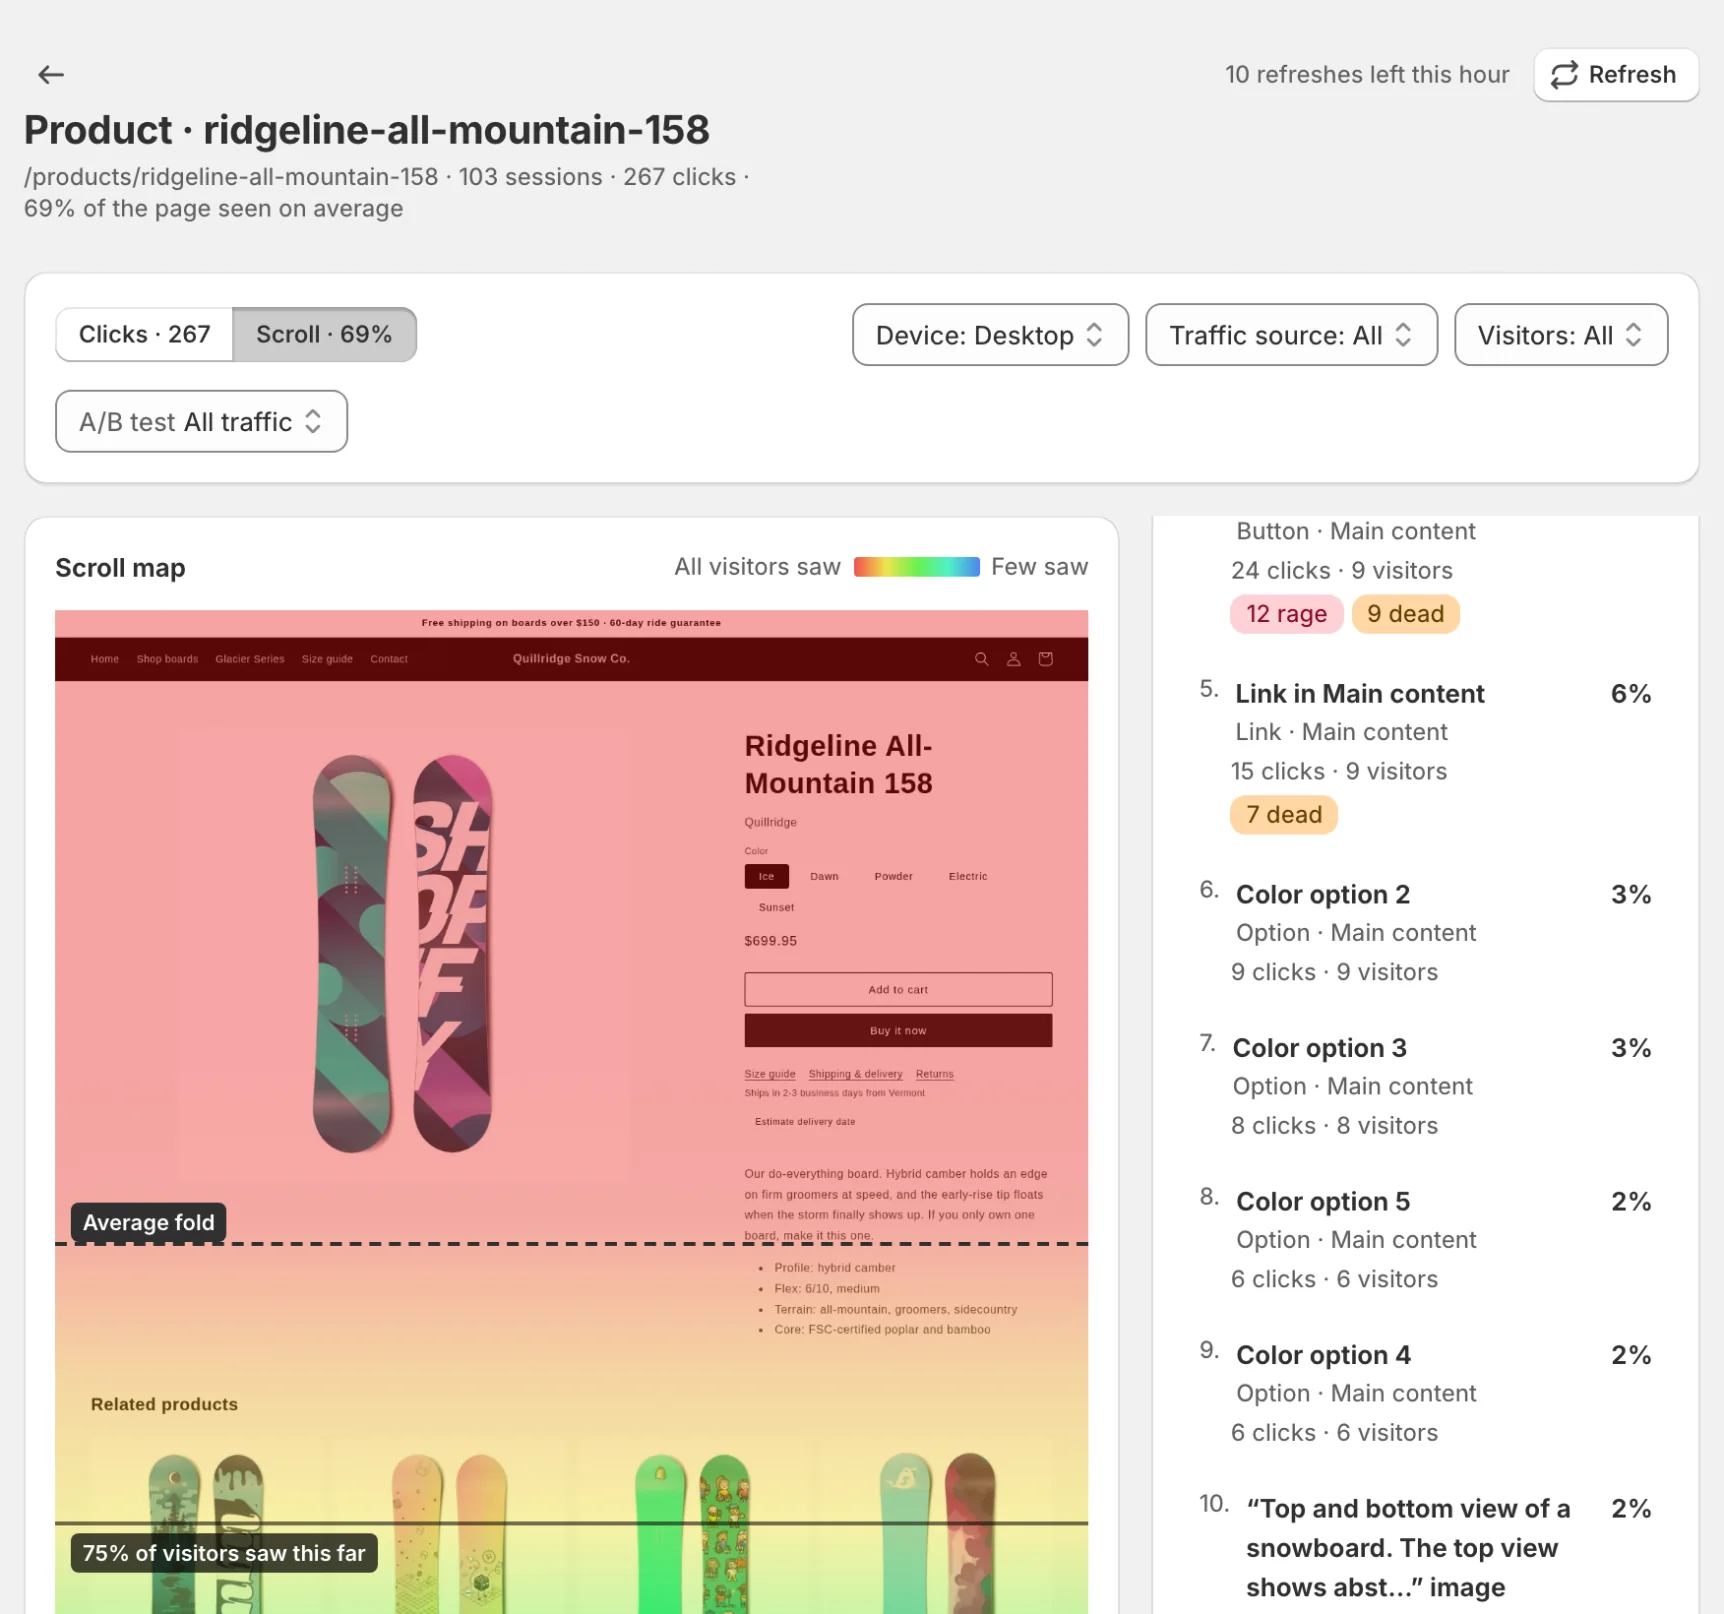
Scroll Depth
Scroll maps reveal how far down the page visitors scroll. This helps you understand:
- Where attention drops off
- If important content is being seen
- Optimal placement for CTAs
Viewing Heatmaps
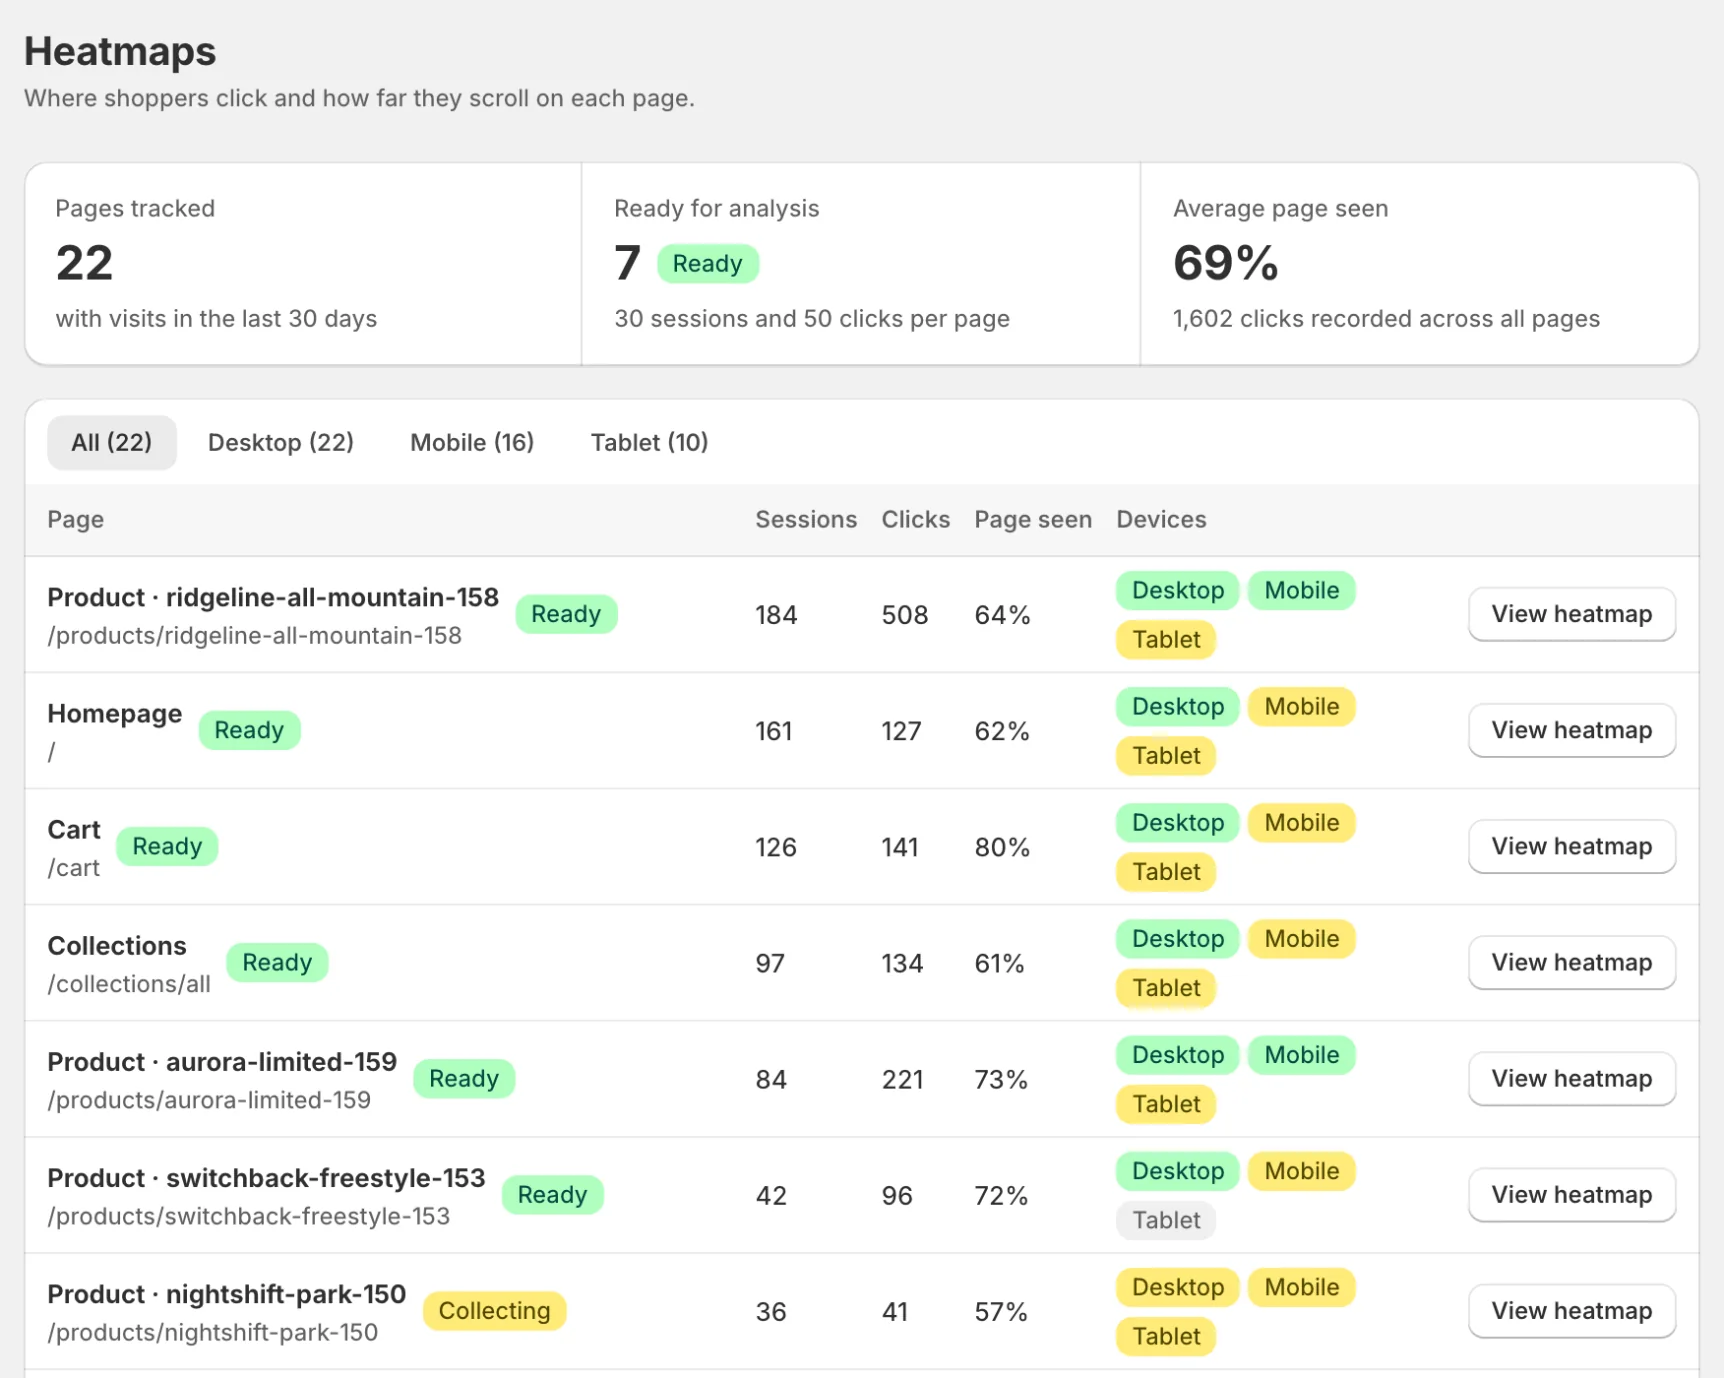
- Go to Heatmaps in the sidebar; the list shows every page with a Ready or Collecting badge
- Click View heatmap on a page
- Switch between Clicks and Scroll, and filter by Device, Traffic source, Visitors and period (the last 7, 30 or 90 days; 30 by default)
- Read the sidebar: Summary, Top clicked elements and Scroll depth
Page Limits
Heatmap page limits depend on your plan:
- Free: 1 page
- Starter: 25 pages
- Growth: Unlimited pages
- Pro: Unlimited pages
Data Requirements
Heatmaps become available once a page has enough interactions to be meaningful.
- Minimum to show “Ready”: 30 sessions and 50 clicks; until then the page shows a banner with progress bars toward both numbers
- Recommended for confident decisions: 100+ sessions and 200+ clicks
- Segment by device: desktop and mobile behavior often differs
For details on accuracy, segmentation, and common pitfalls, see Data Quality.
For segmentation (visitor type, traffic source, UTMs, and A/B variants), see Heatmap segmentation.
How heatmaps relate to recordings
Insights
Once a page has enough data, the Insights card flags hot zones, dead zones and scroll drop-offs, each with a recommendation. Scroll drop-offs and areas shoppers see but don’t click are detected automatically; AI insights are included on paid plans.
See Insights for when they unlock and how to interpret them.
Screenshots
Heatmaps can be overlaid on a captured screenshot of your page for easier interpretation. Popups, cookie banners and chat widgets are hidden before the screenshot is taken; your sticky header and sticky add-to-cart bar stay. See Screenshots.
Top clicked elements
Next to the heatmap, Top clicked elements lists what shoppers clicked, by element: its name and the section it sits in, its share of all clicks, the number of clicks and visitors, and how many were rage or dead clicks. Hover an element to outline it on the heatmap; select it to keep the outline and show a Watch recordings button that opens the recordings of the visitors who clicked it (on the Rage clicks or Dead clicks layer it reads Watch rage clicks or Watch dead clicks). Clicks are matched to elements up to 15 minutes after a visit ends.
Troubleshooting
If a page isn't showing up, check thresholds and whether recording is enabled. See Troubleshooting.