Heatmaps: Insights
Hot zones, dead zones and scroll drop-offs on a page, each with a recommendation.
When Insights Appear
Insights need enough data to be worth reading: 30 sessions and 50 clicks on the page. Until then the heatmap shows progress toward both numbers, and the sidebar still gives you the summary, top clicked elements and scroll depth. Once unlocked, click Refresh insights on the Insights card to generate or update them.
What the Insights Card Shows
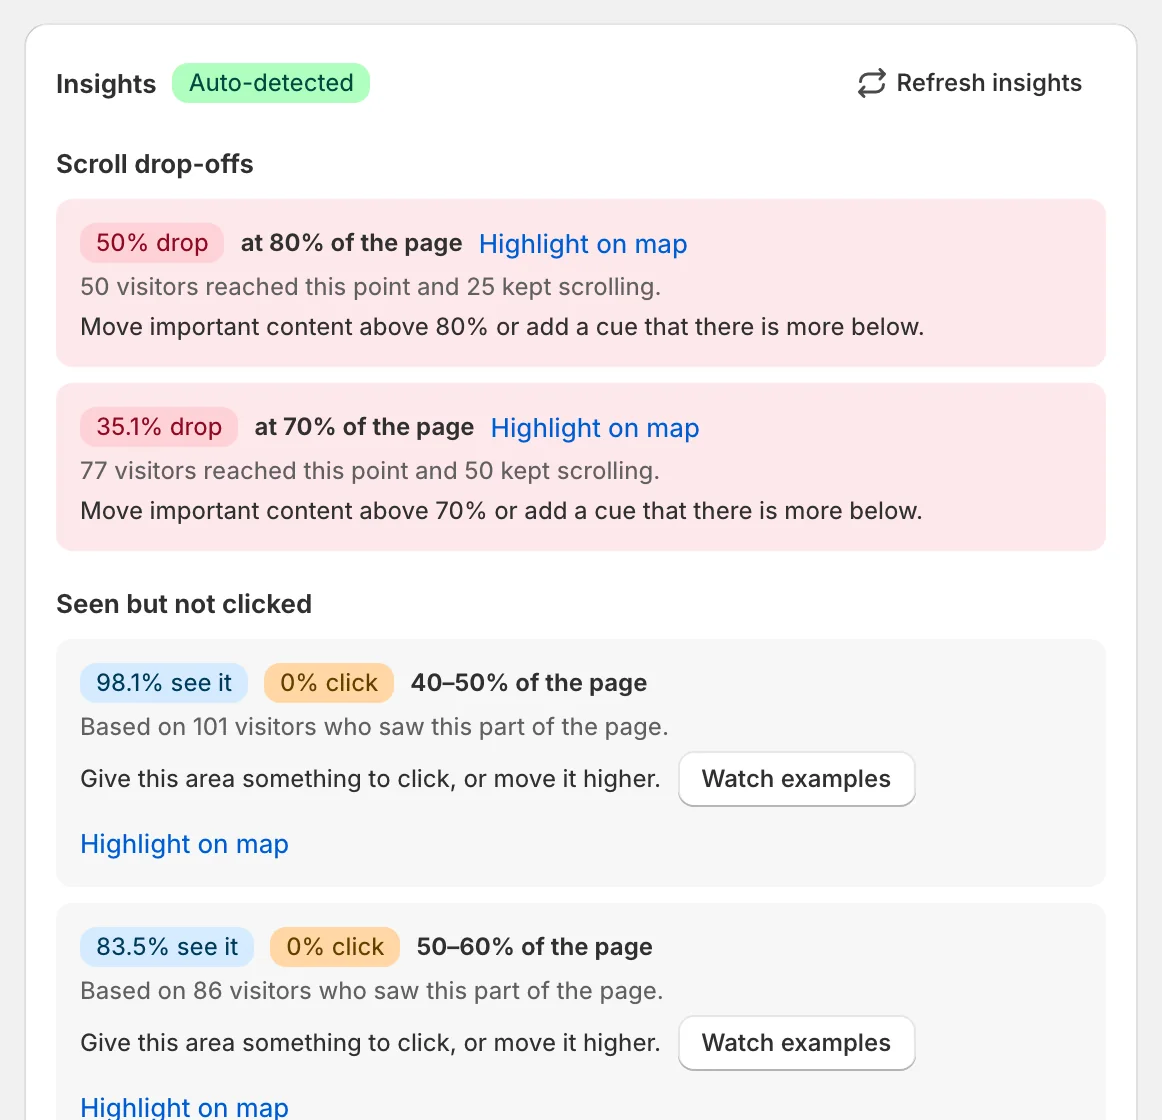
- Scroll drop-offs: where a large share of visitors stop scrolling, with how many reached that point and a recommendation. Detected automatically.
- Seen but not clicked: areas most visitors scroll past without clicking, with Watch examples to open matching recordings. Detected automatically.
- AI insights: hot zones, dead zones and other patterns, each with a recommendation. AI insights are included on paid plans; the Free plan doesn’t include AI.
Insights with a location are numbered on the heatmap; use Show on map or Hide on map to toggle them.
Use insights as hypotheses, not facts
AI insights are suggestions based on the data available. Always validate with recordings, business context, and (when appropriate) an A/B test.
Quotas and Rate Limits
AI operations may be limited by your plan and protected by rate limiting. If you hit a limit, try again later or upgrade your plan. See Billing & Plans.