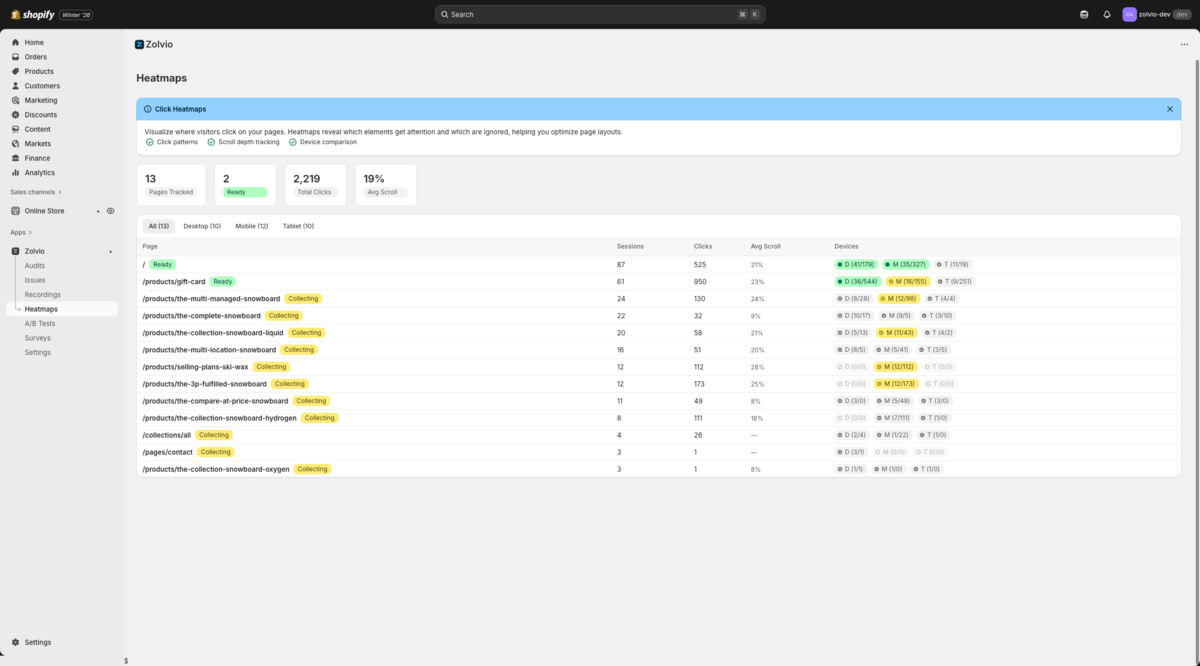
Heatmap Segmentation
Segment heatmaps to answer “for which visitors is this happening?” and avoid optimizing for the wrong traffic.
Screenshot placeholder
1200×650px •
/docs-images/heatmaps/heatmap-filters-1200x650.pngAdd a file at this path to replace the placeholder.
Start with “All devices”, then drill down
Most stores don’t have enough traffic for meaningful tablet-only analysis. Start with an All devices view to spot patterns quickly, then drill down into desktop and mobile to validate that the pattern holds.
Confidence matters
Zolvio can show heatmap data even when sample size is low, but it should warn you. Use insights (dead zones, drop-offs) only when sample size is high enough to trust.
Common segmentation dimensions
- Device: desktop vs mobile behavior often differs (tap targets, sticky CTAs, scroll depth).
- Date range: compare before/after changes and avoid mixing old and new layouts.
- Visitor type: new vs returning visitors can click very differently.
- Traffic source: search vs social vs direct often has different intent and scroll depth.
- Campaign tags: UTM source/medium/campaign (when enabled) to validate paid landing pages.
A/B tests: filter by variant
When an A/B test is running, you should be able to view heatmaps by variant to explain why a result changed: did Variant B push clicks to the CTA? Did it reduce rage clicks? Did it move attention above the fold?
Screenshot placeholder
1200×650px •
/docs-images/heatmaps/ab-compare-1200x650.pngAdd a file at this path to replace the placeholder.
See A/B: Heatmaps & Recordings for the full workflow.
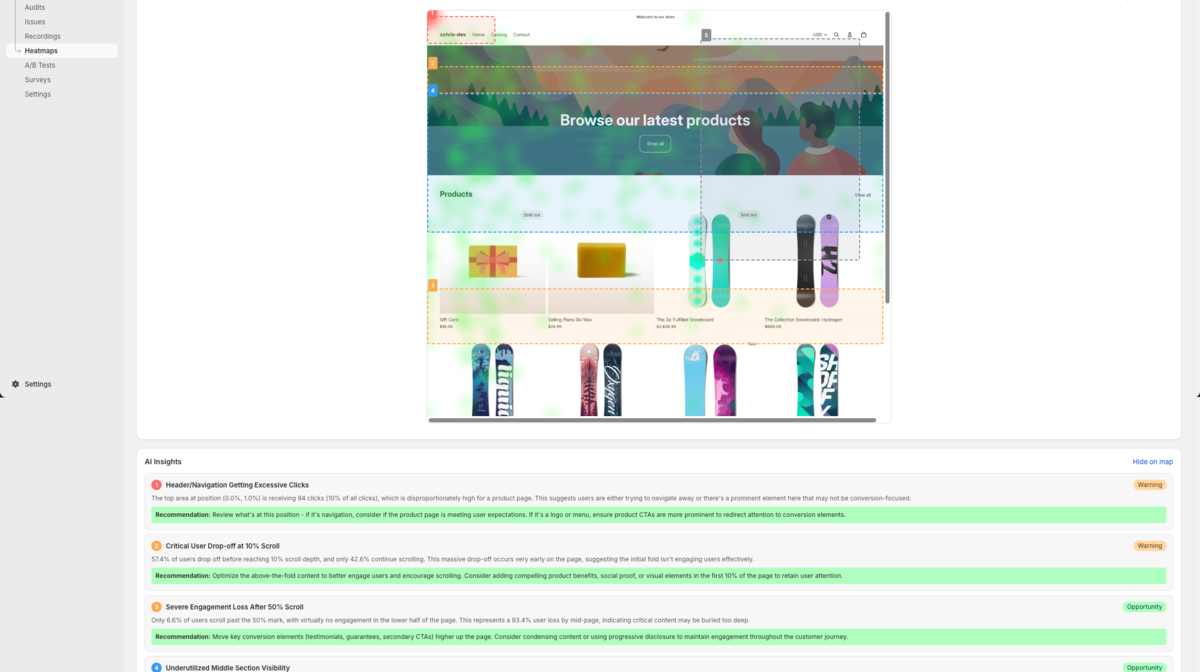
From heatmap to proof: watch examples
The fastest way to build confidence is to jump from a hotspot or dead zone to real recordings that match that behavior.
- Open a heatmap for a key page (homepage, collection, product).
- Click a hotspot/dead-zone insight to open Watch examples.
- Review 5–10 sessions and confirm the pattern is real (and not noise).
- Apply a guided fix and re-check in a few days.
Troubleshooting
- If you see “no data”, first confirm recording is enabled and consent is configured.
- If screenshots don’t match your current theme, refresh the screenshot and check screenshot limitations.
- If you changed the page layout recently, narrow the date range to avoid mixing old/new UI.